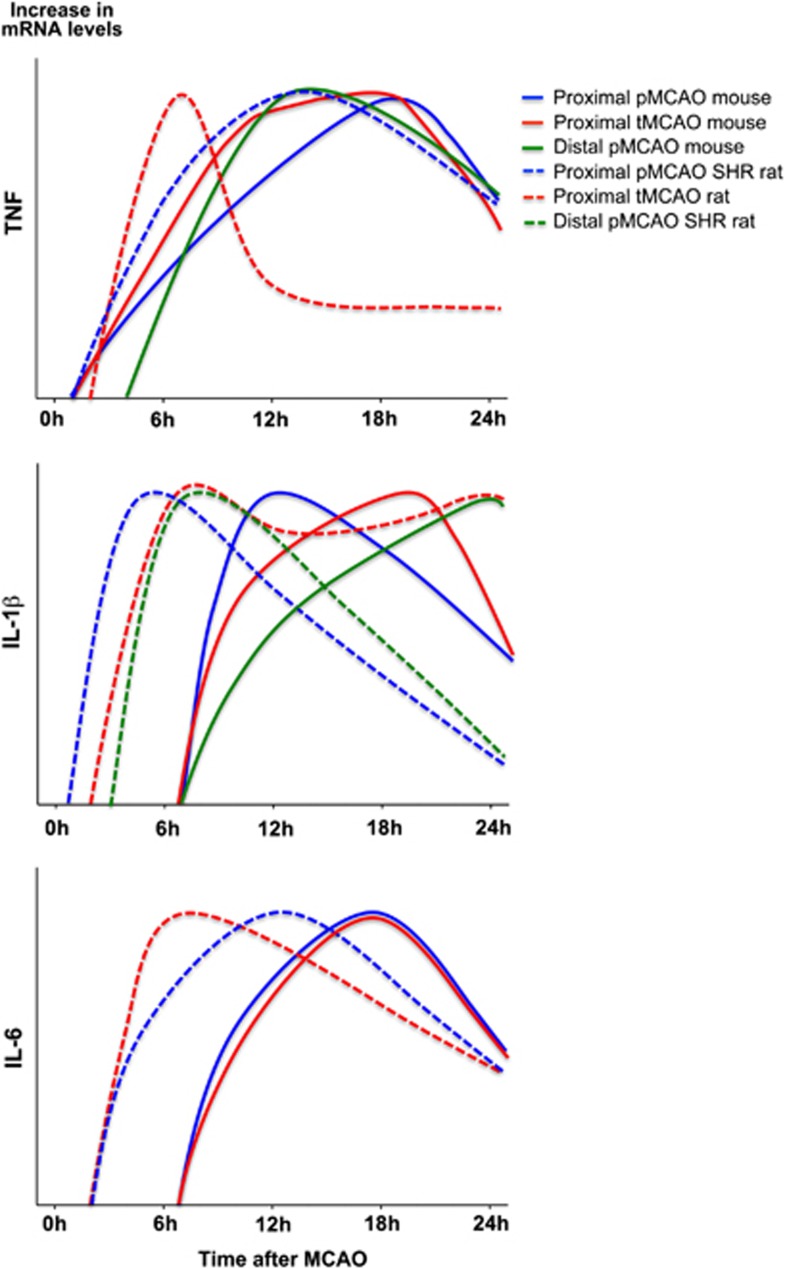
Figure 3.
Temporal cytokine messenger RNA (mRNA) profile in experimental stroke. Graphic presentations of the temporal mRNA profiles of tumor necrosis factor (TNF), interleukin (IL)-1β, and IL-6 mRNA in the acute phase (<4 to 6 hours) and up till 24 hours after permanent MCAO (pMCAO) and transient MCAO (tMCAO) in mice (solid lines) and rats (dotted lines). Data are presented as relative increases in mRNA levels on an abitrary y axis and the peak time of expression after surgery on the x axis. Data for TNF were obtained from: solid blue and red (Hill et al, 1999); solid green (Lambertsen et al, 2009); and dotted blue (Liu et al, 1994) and red (Berti et al, 2002). Data for IL-1β were obtained from: solid blue and red (Hill et al, 1999); solid green (Clausen et al, 2005); dotted blue (Wang et al, 1994); dotted red (Berti et al, 2002); and dotted green (Wang et al, 2000). Data for IL-6 were from: solid blue and red (Hill et al, 1999), dotted blue (Wang et al, 1995); and dotted red (Berti et al, 2002).

