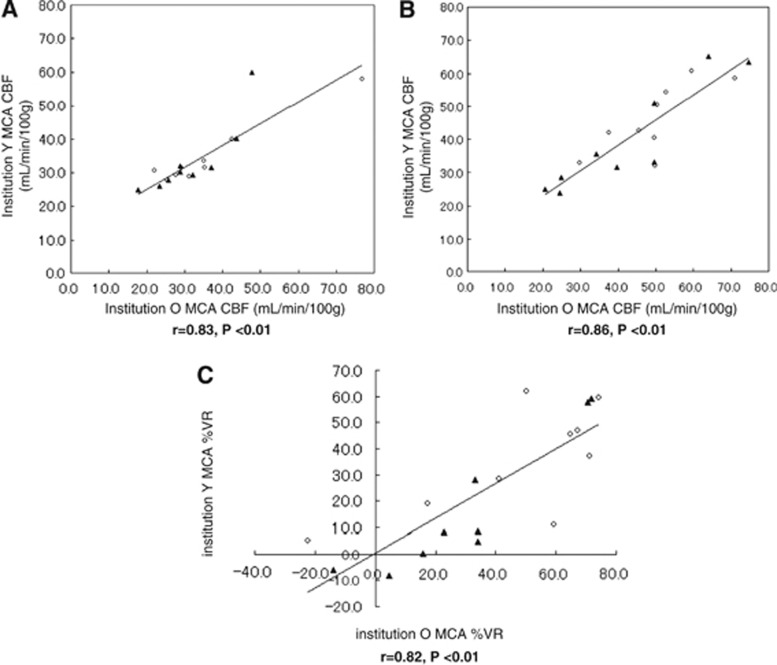
Figure 3.
Scatter diagrams and regression lines of middle cerebral artery (MCA) cerebral blood flow (CBF) quantitation and percentage vascular reserve (%VR) in the two facilities. CBF quantitation and %VR in institutions O and Y are plotted on the x-axis and y-axis, respectively. Data are shown for the affected hemisphere (closed triangles) and the unaffected hemisphere (open circles). There were significant correlations between the two facilities for (A) CBF at rest (9 patients, n=18 data points, r=0.83, P<0.01) (B) CBF after acetazolamide challenge (9 patients, n=18, r=0.86, P<0.01), and (C) %VR for the affected and unaffected hemispheres (9 patients, n=18, r=0.82, P<0.01).

