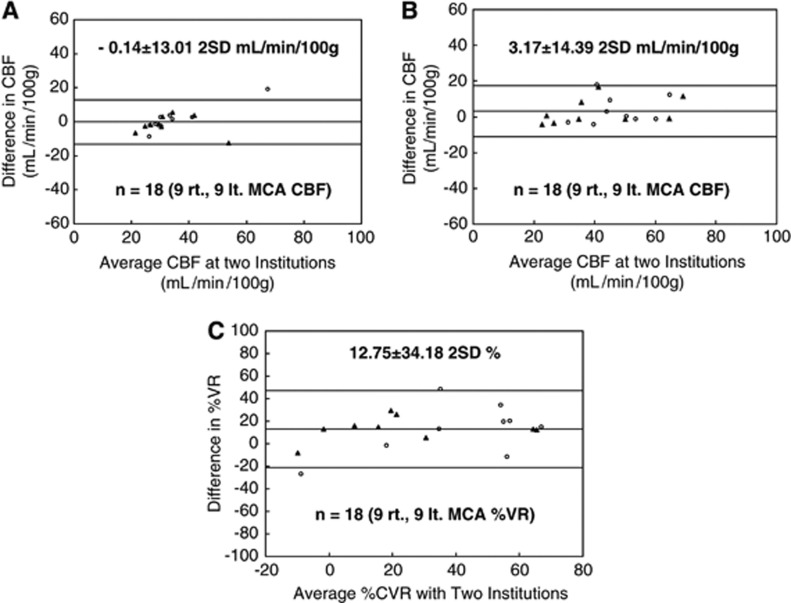
Figure 4.
Bland–Altman plots of the consistency of middle cerebral artery (MCA) cerebral blood flow (CBF) measured in the two facilities. Data are shown for the affected hemisphere (closed triangles) and the unaffected hemisphere (open circles). Differences in CBF and percentage vascular reserve (%VR) were calculated as the value at institution O—that at institution Y. (A) CBF at rest (9 patients, n=18 data points). A small bias was detected (mean difference, −0.14 mL per 100 g per minute) and the 2 s.d. was moderate (13.01 mL per 100 g per minute). (B) CBF after acetazolamide challenge (9 patients, n=18). A small bias was detected (mean difference, 3.17 mL per 100 g per minute) and the 2 s.d. was moderate (14.39 mL per 100 g per minute). (C) %VR for the right and left hemispheres (9 patients, n=18). A moderate bias was detected (mean difference, 12.75%) and the 2 s.d. was moderate (34.18%).

