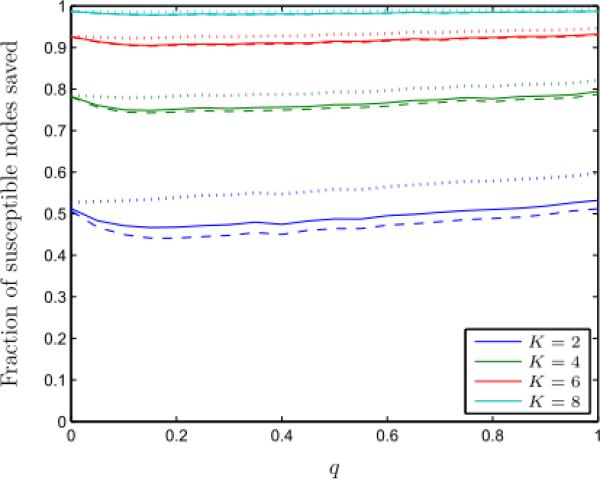
Figure 6.
The fraction of susceptible nodes saved under the optimal partition (solid line) and QCQP approach (dashed line) in small-world graphs as a function of the re-wiring probability, q, and for different link removal constraints, K. The performance bound derived from the SDP is shown for each case (dotted line). Evaluated over 5,000 sample small-world graphs of 15 nodes with 5 infected nodes.

