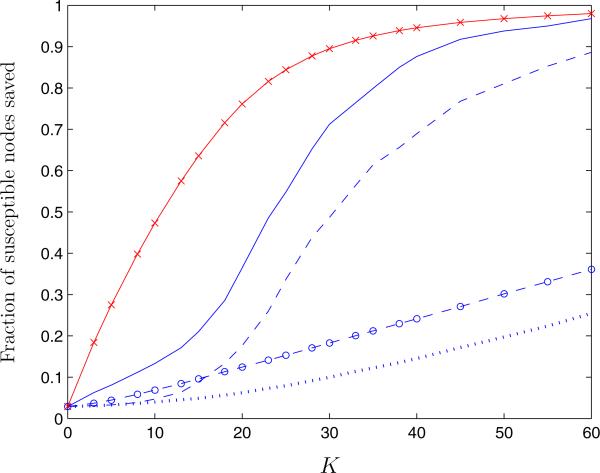
Figure 8.
Average fraction of susceptible nodes saved from infection in finite scale-free networks with degree distribution ~ k−2.1 as a function of the number of links removed, K, using the QCQP approach (solid line), the SI edge centrality measure (dashed line), the standard edge centrality measure (dotted line), and the bridgeness index (circle label). The performance bound derived from the SDP is also shown (cross label).

