
Table 4.
mazE-cd and mazF-cd transcripts are upregulated under antibiotic stressa
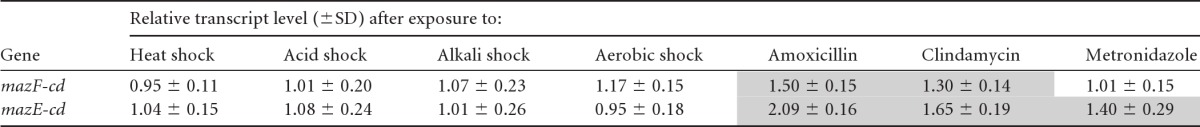
a
Shaded values are transcripts upregulated by 25% or more and are adapted from data reported by Emerson et al. (10). Antibiotic concentrations used were 1 mg/ml amoxicillin, 50 mg/ml clindamycin, and 0.15 mg/ml metronidazole. Values shown are averages from duplicate microarray experiments.