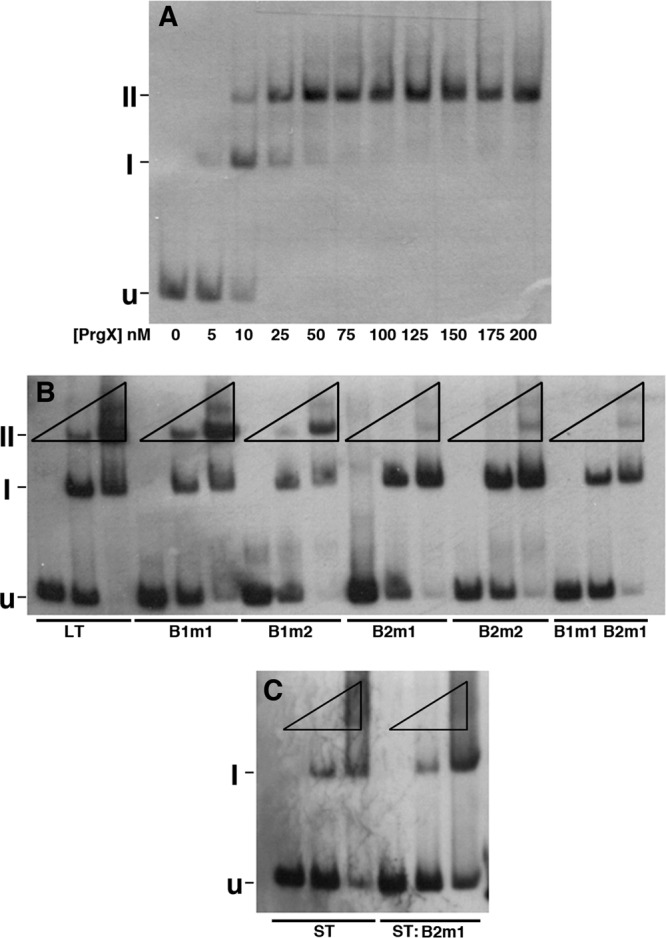
Fig 2.

Binding of purified PrgX to pCF10 DNA templates as determined by electrophoretic mobility shift assay (EMSA). Binding reaction mixtures contained 2.5 nM digoxigenin-labeled DNA probes and various PrgX concentrations. In all three gels shown, “U” indicates the position of the unbound probe, “I” represents a shifted complex, and “II” represents a supershifted complex. Band I probably represents a PrgX dimer bound to XBS1, whereas band II represents a looped probe molecule with both XBSs occupied by a dimer. (A) Binding of PrgX to wild-type LT. Concentrations of PrgX (nM) are indicated below the respective lanes. (B) Binding of PrgX to LT derivatives with XBS mutations (indicated below the lanes). For each DNA, the mobility shifts were determined at PrgX concentrations of 0, 10, and 125 nM (indicated by the triangles above each set of 3 lanes run with the same DNA probe), since these produced, respectively, no shift, partial shift, and nearly complete shift of the LT probe. (C) Binding of PrgX to ST and ST:B2m1 probes (indicated below each lane). The same DNA and PrgX concentrations were used as those in panel B.
