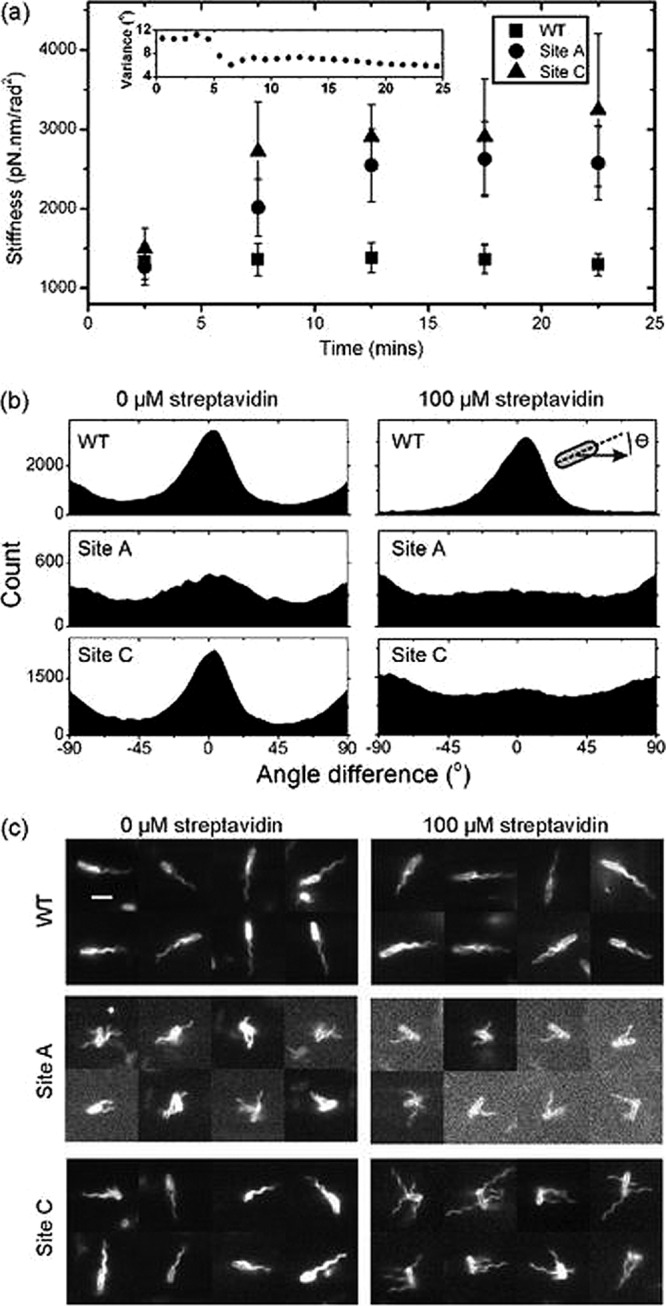
Fig 2.

Biophysical characterization of site A and site C AviTag mutants in response to streptavidin. (a) Hook stiffness of single tethered cells over time calculated using the equipartition theorem (see the text for details). Streptavidin (100 μM) was added at t = 5 min; stiffnesses are means ± standard errors of 28, 31, and 27 hooks from WT, site A, and site C strains, respectively. The inset shows the variance in body angle of a single cell from the site A data set versus time. (b) Analysis of free-swimming cells (see Videos S1, S2, and S3 in the supplemental material); histograms of the difference in angle between the cells' swimming trajectory and the angle of the cell body (illustrated by the inset). A cell swimming along its long axis gives an angle of 0°. (c) Selected video frames (3-ms exposure) of swimming cells dyed with Cy3 monofunctional succinimidyl ester showing the position of filaments. Scale bar, 3 μm (see Videos S4, S5, and S6).
