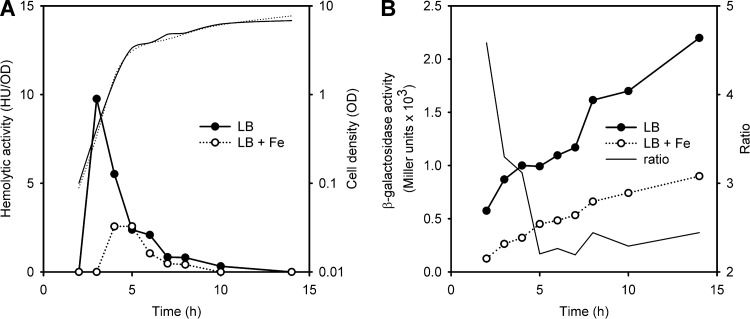
Fig 2.
Expression of hemolysin II is reduced in the presence of FeCl3. Cells were grown in LB at 37°C. Experiments were repeated 2 times, and representative curves are shown. (A) HlyII-specific cholesterol-independent hemolytic activity of B. thuringiensis VKM B-1555 cultures. Corresponding growth curves are shown in by thin lines. (B) Expression pattern of an hlyII-lacZ fusion in B. thuringiensis VKM B-1555. The ratio for β-galactosidase activity with or without added FeCl3 is shown in by the thin line. ●, control; ○, 0.3 mM FeCl3.

