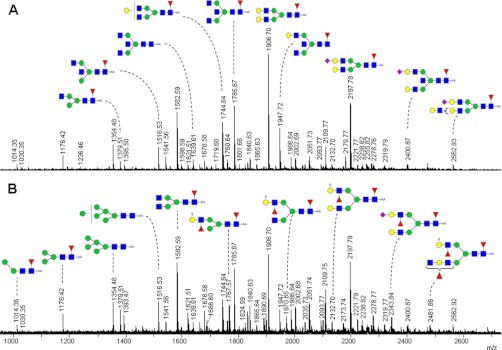
Fig. 3.
Negative ion mode MALDI-TOF-MS spectra of AA-labeled N-glycans released from a tumor (B) and its paired control tissue (A). Proposed composition of the N-glycan structures released from the colon tissues and deduced from the MALDI-TOF(/TOF)-MS are listed in supplemental Table I. Only major structures are depicted. The m/z values present in both A and B are annotated either in A or in B. Glycan schemes were prepared using GlycoWorkbench. Red triangle, fucose; yellow circle, galactose; green circle, mannose; blue square, N-acetylglucosamine; purple diamond, sialic acid.

