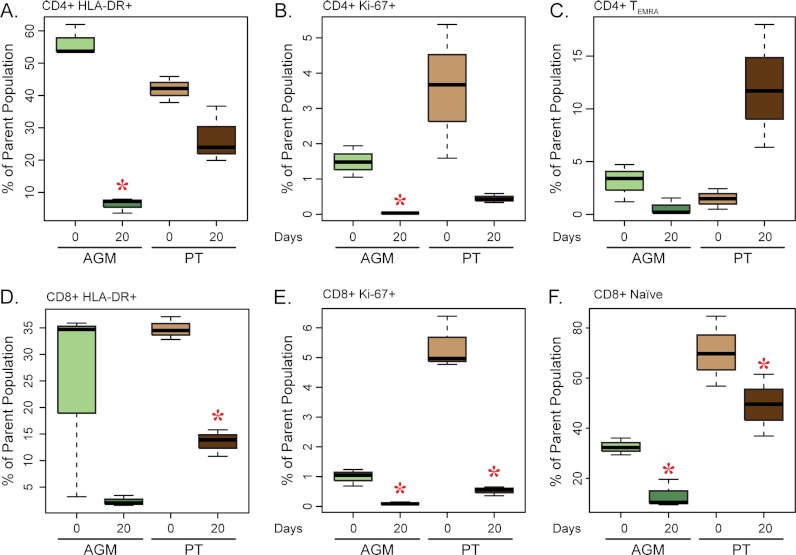
Fig. 4.
Analysis of activated T cells in the lymph node. Boxplots representing the percent distribution of CD4+ HLA-DR+ (A), CD4+ Ki-67+ (B), CD4+ TEMRA (C), CD8+ HLA-DR+ (D), CD8+ Ki-67+ (E), and CD8+ Naïve (F) cells. The dark bar within the box represents the median, the box indicates the interquartile range, and the whiskers show the overall range. AGM values are indicated by light and dark green boxes for pre- and postmorphine, respectively. PT values are represented by light and dark brown boxes for pre- and postmorphine, respectively. Red asterisks indicate a significant change (p < 0.05) in cell count during morphine administration as determined by a paired t test.

