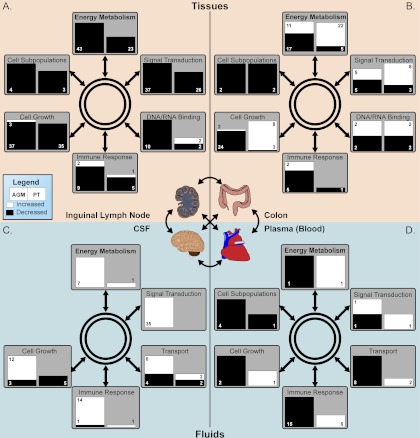
Fig. 7.
Model schema of morphine immunosuppressive effects across various biological compartments in NHP. Samples were divided between tissues (A and B) and fluids (C and D). The tissue samples were inguinal lymph node (A) and colon (B) biopsies whereas the fluid samples were composed of CSF (C) and plasma (D). The left and right sides of the colored box indicate significant changes in AGMs or PTs, respectively. The size of the boxes are scaled to represent the number of proteins significantly altered within the functional category and numbers indicate the number of proteins whose abundance is significantly changed or the number of cellular subpopulations significantly altered in the case of “Cell Subpopulations.” White represents a significant increase and black a significant decrease.

