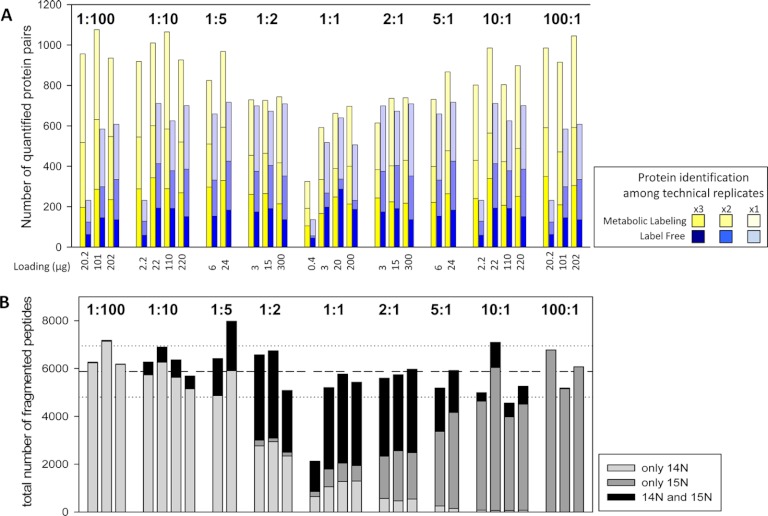
Fig. 2.
Numbers of quantified proteins. A, The number of protein pairs quantified in different mixing ratios and in samples of different total protein content. B, Total number of fragment spectra acquired in all three replicates of each sample as sorted for the unlabeled peptide only, the labeled peptide only or for both peptide forms. Dashed line represents the average of total fragment spectra acquired across all sample, dotted lines represent standard deviation.

