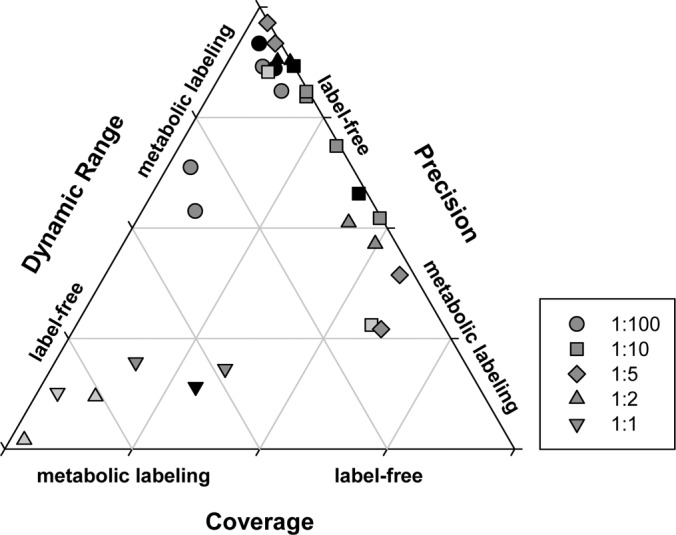
Fig. 6.

Ternary plot to assess performance of quantitation by label-free method or 15N-metabolic labeling based on proteome coverage, quantitative precision and dynamic range for different mixing ratios. Shadings of gray indicate increasing total protein loading: light gray less than 10 μg; dark gray, 10–100 μg; black, more than 100 μg protein.
