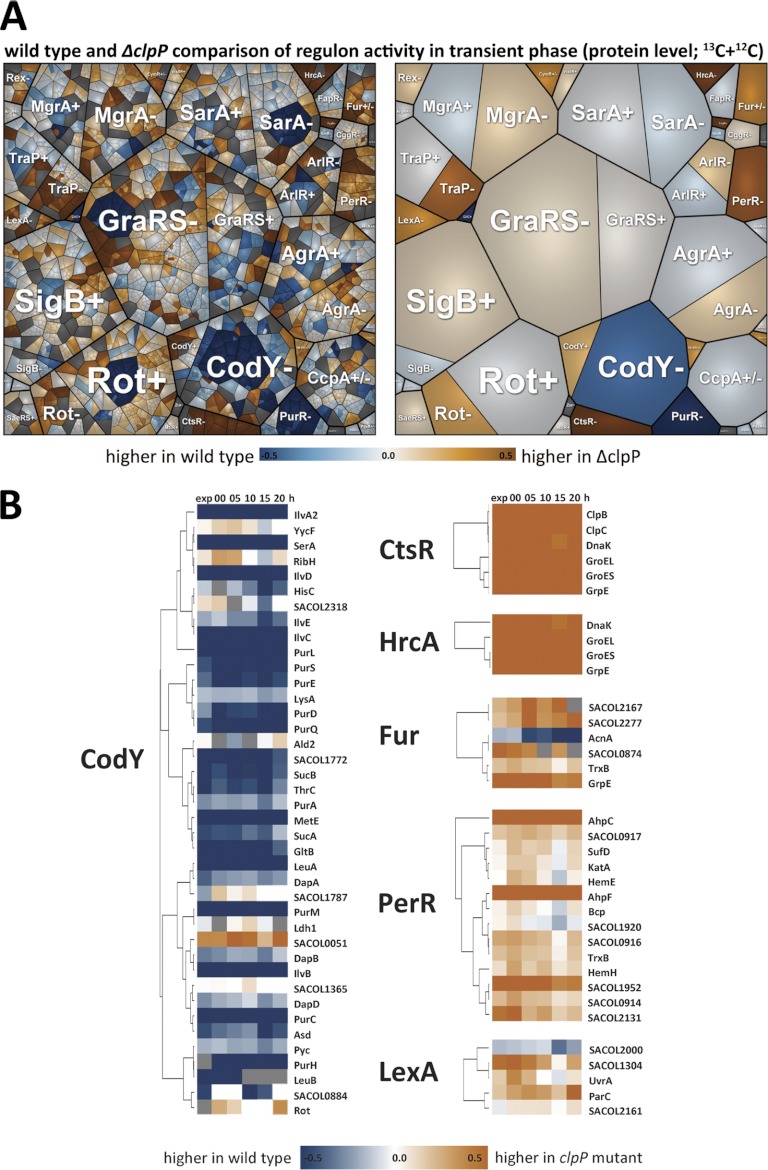
Fig. 6.
A, A Voronoi treemap of clustered regulons. Values reflect protein accumulation ratios from the wild type and the clpP mutant during transient growth. ± indicates positive or negative control by the regulator. B, The protein accumulation ratios (log10) from selected proteins are depicted for the CodY-, CtsR-, HrcA-, Fur-, PerR-, and LexA-regulon. Blue indicates stronger accumulation in the wild type and dark orange indicates stronger accumulation in the clpP mutant.

