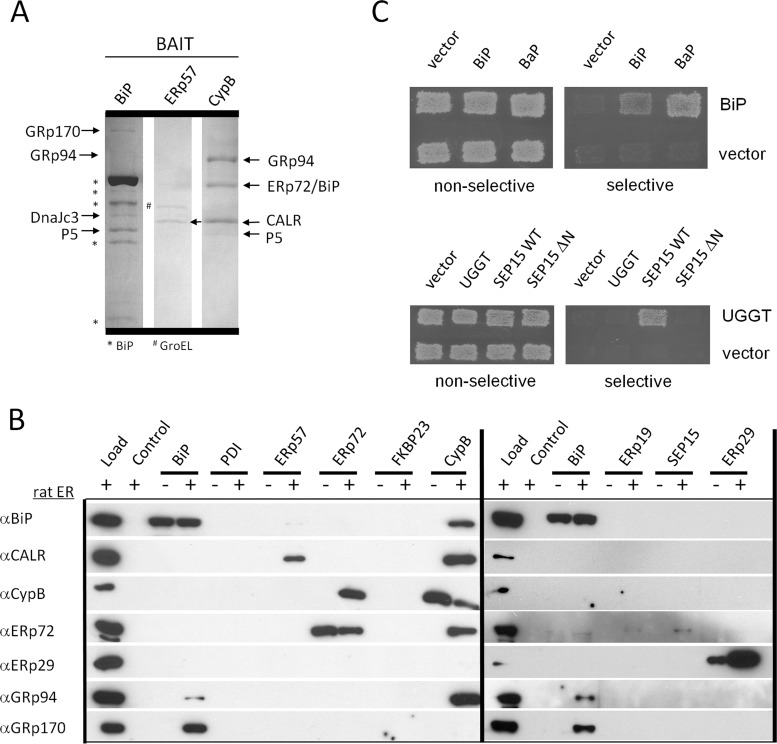
Fig. 1.
ER protein interaction map by affinity and ER-MYTHS methods. A, SDS-PAGE of rat ER proteins purified by affinity to the bait proteins BiP, ERp57, and cyclophilin B. The bands were cut and identified by mass spectrometry. B, Western blots identify proteins purified from rat ER by affinity to recombinant bait proteins. Load, 20 μg of rat ER; Control, beads blocked with ethanolamine; −, no ER added; +, ER added. C, example of ER-MYTHS interactions. Upper panel, BiP interacts with itself and the nucleotide exchange factor Bap. Transformants were grown under conditions nonselective for interactions (SD-LT) and selective (SD-LTAI). Lower panel, UGGT interacts with full-length SEP15 (WT) but not with itself or N-terminally truncated SEP15ΔN (62–178aa). (See also supplemental Fig. S1 and Tables SI–SIV.)

