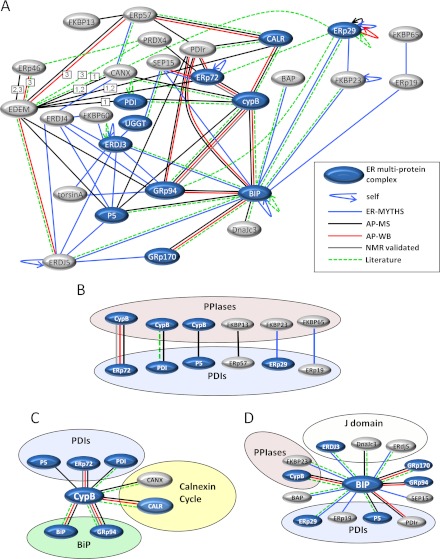
Fig. 2.
The interaction map of ER chaperones and foldases. A, combined map of all ER protein-protein interactions detected with edge color representing interactions detected by the ER-MYTHS (blue), AP-MS (affinity purification results by mass spectrometry, black), affinity purification results by Western blotting (AP-WB, red), interactions validated by NMR experiments (grey), and interactions already validated in the literature (green). Members of the previously identified ER multiprotein complex are shaded in blue. Curved arrows represent self-interactions. EDEM 1, 2, and 3 are represented by EDEM, but in cases where an interaction was not observed with all three family members, the number corresponding to the member(s) that interact is indicated in a white box on the connecting edge. B, interactions detected between PDIs and PPIs. C, all cyclophilin B interactions detected grouped by protein family with PDIs, calnexin cycle chaperones, and BiP chaperones. D, all of the BiP interactions detected, highlighting J-domain containing proteins, PDIs, and PPIs. (See also supplemental Tables SI–SIV and Figs. S2–S5.)

