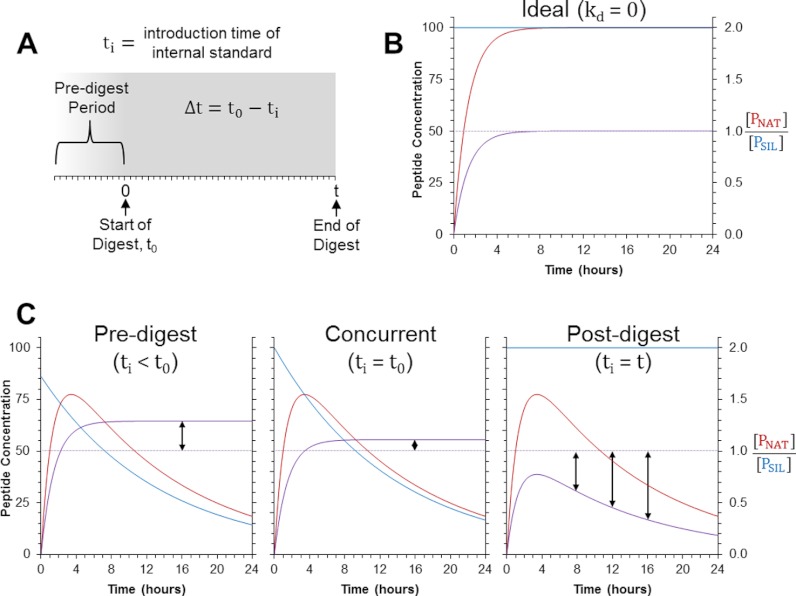
Fig. 1.
Theoretical models for peptide production and decay during AQUA workflows. A, Shown is the sample preparation timeline for AQUA-workflows. Here, t0 is the time point when digestion begins and is set to 0 h in this frame of reference such that the length of the digestion period is defined by t. The time point at which the SIL peptide is introduced to the sample is called ti and the time difference, Δt, between the start of the digestion (t0) and the introduction of the SIL peptide (ti) is defined by the equation shown. B, Shown is the model for the ideal situation, where no decay of the NAT peptide (PNAT) or SIL peptide (PSIL) occurs. C, Depicted are the modeled results when the SIL is introduced into the sample predigestion (Δt = 2 h), concurrently with the enzyme (Δt = 0), or postdigestion (Δt = –t). The blue and red lines in each plot indicate [PNAT] and [PSIL], respectively. The light purple line indicates the correct ratio of [PNAT] and [PSIL] under ideal conditions, while the dark purple line shows the “measured” ratio. These plots were created using the following criteria: [SNAT]0 = [PSIL]0 (to give an expected ratio of 1), kp = 0.750 h−1, and kd = 0.075 h−1.

