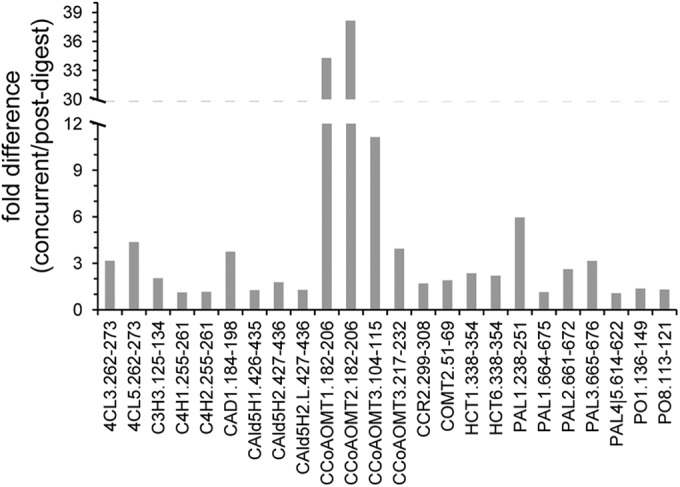
Fig. 3.

Differences observed in the measured concentrations between the concurrent and post-digest SIL additions at t = 8 h. The protein concentrations were calculated using Equation 2. The 8 h time point was selected given it was the earliest time point in which all targeted peptides were fully produced by proteolysis. The fold difference between the two methods was calculated as the concurrent/postdigest ratio. The protein concentrations measured were always greater when the SIL peptide was added concurrently, which explains why all of the calculated fold differences are greater than 1.
