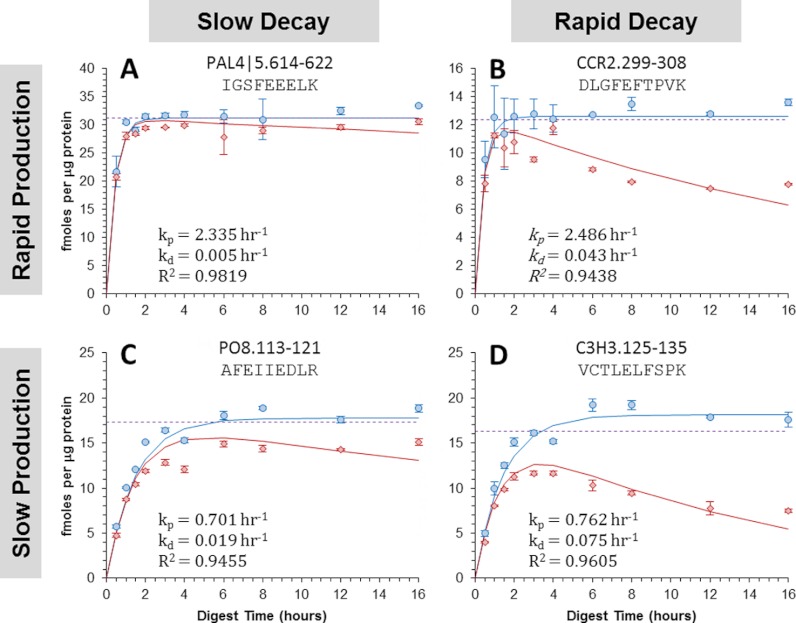
Fig. 4.
Digestion curves obtained for four distinct peptides showing different combinations of peptide production and decay rates. The results for these peptides are categorized by the production-decay rate combinations (A) rapid-slow, (B) rapid-rapid, (C) slow-slow, and (D) slow-rapid. The circles show the quantitative results obtained when the SIL mixture was added concurrently with the enzyme and the diamonds show the results when it was added post-digestion. Each data point is the mean value calculated with equation 2 from three replicate injections and the error bars represent the 95% confidence interval. Using the proposed mathematical models for each type of SIL introduction strategy, the curves for each peptide were obtained by performing non-linear least square regression analysis on both sets of experimental data simultaneously. The rate constants (kp and kd) and coefficients of determination are shown. The dotted line shows the target protein concentration, [S]0, determined by the regression analysis.

