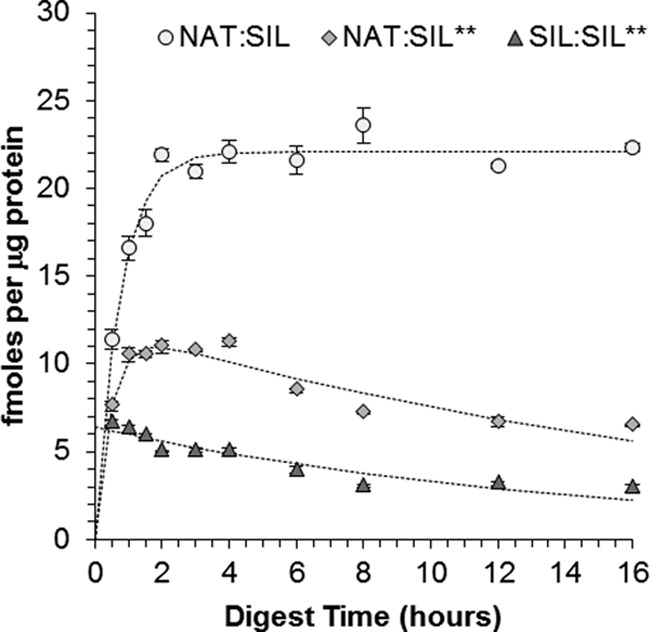
Fig. 5.

Concentrations of HCT1.338–354 measured over the course of the SDX digestion. The data shown here was produced when the SIL Mixture was added concurrent to the trypsin and the double-labeled peptide of HCT1.338–354 (SIL**) was added after the quenching step. The circles show the concentration of endogenous HCT1 measured using the single-labeled standard peptide (SIL) added concurrently and the diamonds show the concentration measured using the double-labeled standard peptide added postdigestion. Similarly, the triangles show the concentration decay of the single-labeled peptide over the course of the digestion as it was measured using the double-labeled peptide.
