
Fig. 6.
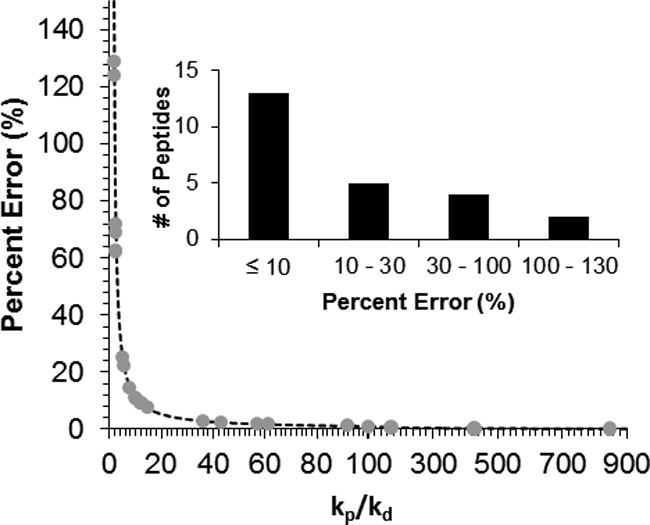
Plot showing the expected quantitative error during concurrent SIL addition as a function of the relative peptide production and decay rates. The dotted line shows the theoretical function when the rate constant for peptide production, kp, is greater than that for peptide decay, kd. The circles show the expected error calculated for all peptides whose rate constants could be determined. Note, the scale of the x axis changes at kp/kd = 100 for better visualization of the data. The inset shows the distribution of the expected relative errors for the 24 detectable surrogate peptides.