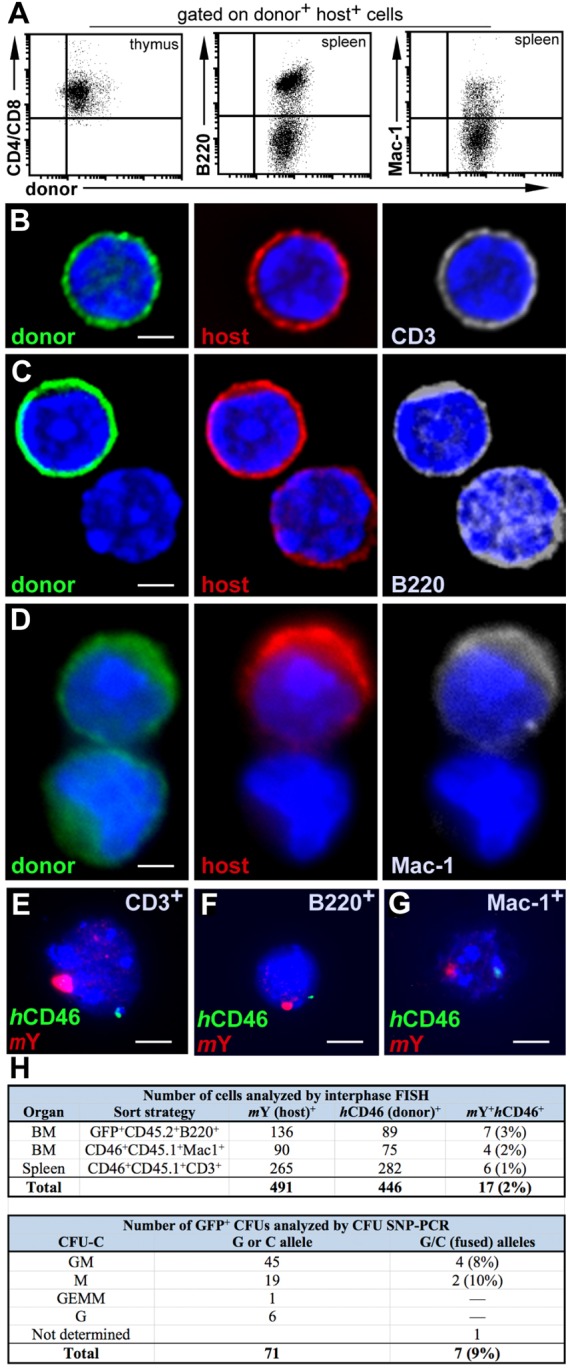
Fig. 2.

Marker co-expression in fusion-derived lymphoid and myeloid cells. (A) Following initial cell sort (Fig. 1A), FACS gates were set to collect CD4+ and/or CD8+ thymic cells (left), B-cell lineage B220+ spleen cells (middle), and myeloid Mac-1+ spleen cells (Wright et al., 2001). (B) Mature CD3+ splenocytes were additionally detected in the CD45.2+ GFP+ B220– fraction of host spleens. Cytospun cells were fixed and stained with anti-GFP Alexa Fluor 488 (green), human CD46–PE (red), CD3–APC (gray) and DAPI (blue). (C) B220+ cells sorted from CD45.1 host spleens were stained with anti-CD45.1–FITC (green), human CD46–PE (red), B220–APC (gray) and DAPI (blue). (D) Staining of Mac-1-sorted splenocytes with anti-CD45.1–FITC (green), human CD46-PE (red), Mac-1-APC (gray), and DAPI (blue). Cells were visualized using deconvolution fluorescent microscopy. Scale bars: 2 µm (B–D). (E) Interphase FISH analysis of CD3+ cells isolated from thymus (F) B220+ cells from spleen (G) or Mac-1+ cells isolated from spleen; cells were probed for mouse Y (red) and human CD46 (green). Scale bars: 5 µm (E–G). (H) Frequency of hematopoietic cell fusion detected by interphase FISH or SNP-PCR. GM, granulocyte or macrophage; M, macrophage; GEMM, granulocyte, erythroid, macrophage or megakaryocyte; G, granulocyte.
