
Fig. 1.
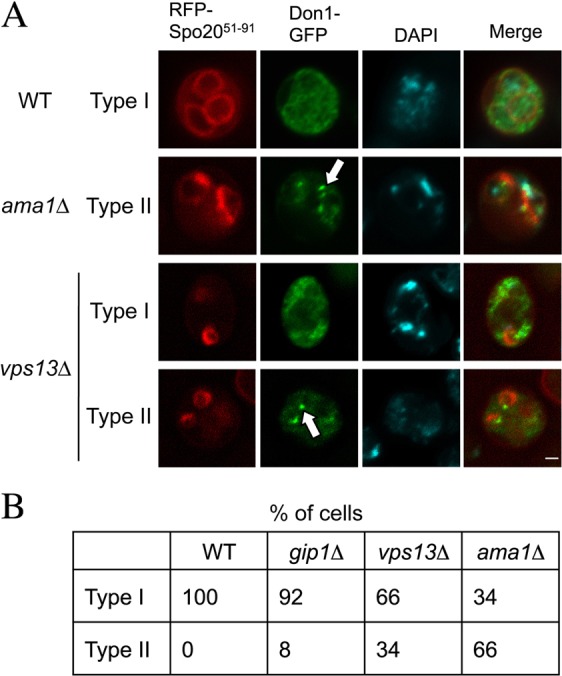
Don1 localization in vps13Δ cells. (A) Representative wild-type (AN120), gip1Δ (NY501), vps13Δ (HI29) and ama1Δ (ADY66) cells transformed with pRS426-RFP-Spo2051–91-DON1-GFP to visualize the prospore membranes and the LEP, respectively. Type I indicates that Don1–GFP was dispersed in the cytoplasm, whereas Type II indicates that Don1–GFP was concentrated on the prospore membrane. White arrows indicate LEPs. Scale bar: 1 µm. (B) Quantification of Don1–GFP distribution in the cells in A. More than 100 prospore membranes were examined for each strain.