
Fig. 2.
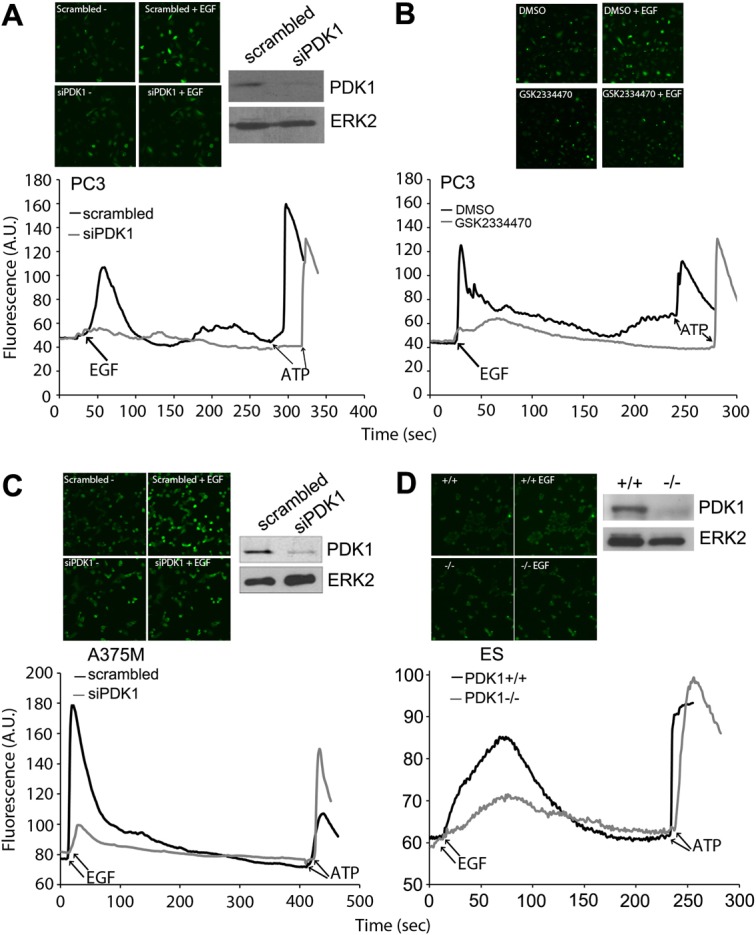
Inhibition of PDK1 impairs EGF-induced calcium increase in different cell lines. (A) Analysis of intracellular calcium variation in PC3 transiently transfected with scrambled siRNA or with siRNA targeting PDK1 upon EGF or ATP stimulation. Levels of PDK1 assessed by western blot analysis are shown. Equal loading was determined using an anti-ERK2 antibody. (B) Analysis of intracellular calcium variation in PC3 treated with 1 µM GSK2334470 upon stimulation with EGF or ATP at the indicated time points (arrows). (C,D) Analysis of intracellular calcium variation in A375M transiently transfected with scrambled siRNA or with siRNA targeting PDK1 (C) and in PDK1+/+ or PDK1−/− ES cells (D) upon stimulation with EGF or ATP at the indicated time points (arrows). Levels of PDK1 assessed by western blot analysis are also shown. Equal loading was determined using an anti-ERK2 antibody. All panels show a representative experiment from three independent experiments. Representative images of unstimulated and EGF-stimulated cells are shown.