
Fig. 4.
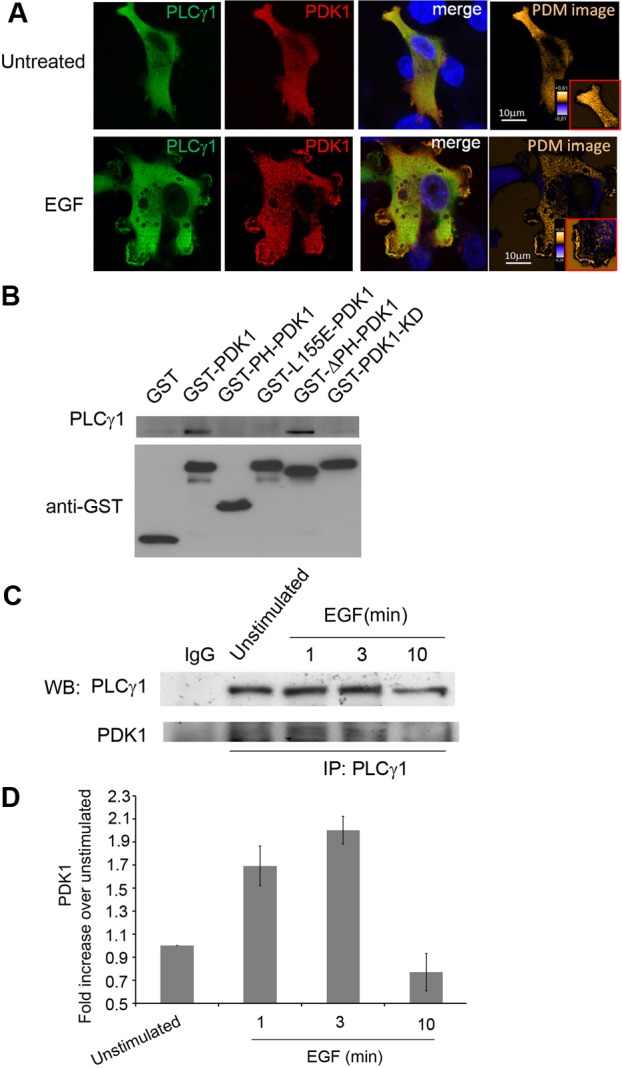
PDK1 associates with PLCγ1 in a protein complex. (A) Serum-starved MDA-MB-231 cells overexpressing PLCγ1 and PDK1 were left untreated or stimulated with EGF for 10 minutes before being fixed and stained with anti-PLCγ1 (green) and anti-PDK1 (red) antibodies. Colocalisation was analysed by confocal microscopy. Pseudo-coloured ‘product of the differences from the mean’ (PDM) images in which each pixel is equal to the PDM value at that location, are shown with a PDM scale. (B) Western blot analysis of PDK1 and PLCγ1 recovered in GST pulldown experiments performed from lysates containing the indicated GST-tagged PDK1 constructs or GST alone (expressed in HEK293 cells) upon incubation with lysates from HEK293 overexpressing PLCγ1. GST or GST–PDK1 proteins were pulled down by glutathione beads. Incubation with anti-GST antibody was used as a loading control. The blot is representative of three independent experiments. (C) Serum-starved MDA-MB-231 cells were left untreated or stimulated with EGF for the indicated times. Co-immunoprecipitation experiments of the endogenous proteins were performed using PLCγ1 antibody, and western blot analysis (WB) was performed using anti-PLCγ1 and anti-PDK1 antibodies. Parallel co-immunoprecipitation with mouse IgG was performed as control. (D) Densitometry analysis performed on three independent co-immunoprecipitation experiments.