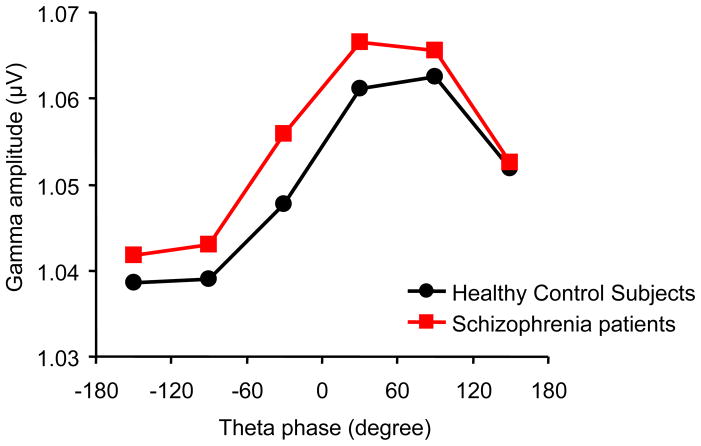
Figure 3.
The amplitude of stimulus-driven gamma oscillations is modulated by the phase of ongoing theta oscillations. This cross-frequency coupling indicates a hierarchical organization of cortical oscillatory dynamics in both healthy control subjects (black line) and schizophrenia patients (red line). The x-axis indicates theta phase. The y-axis indicates gamma amplitude.

