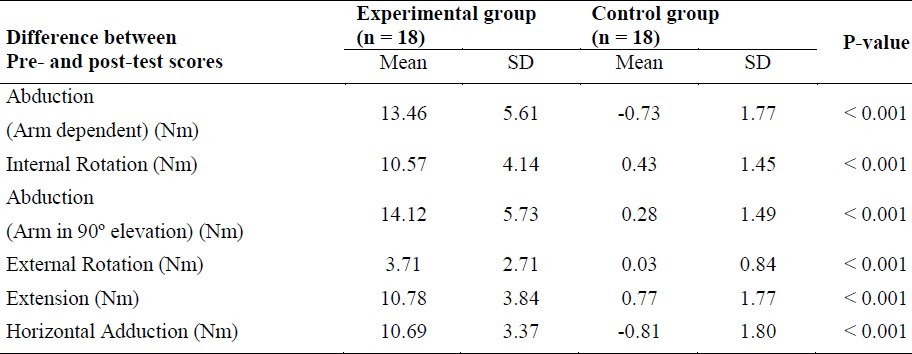
Table 3.
Mean difference between pre- and post-tests’ scores in experimental and controls groups (the bold cells indicate significant difference between two groups)

Mean difference between pre- and post-tests’ scores in experimental and controls groups (the bold cells indicate significant difference between two groups)
