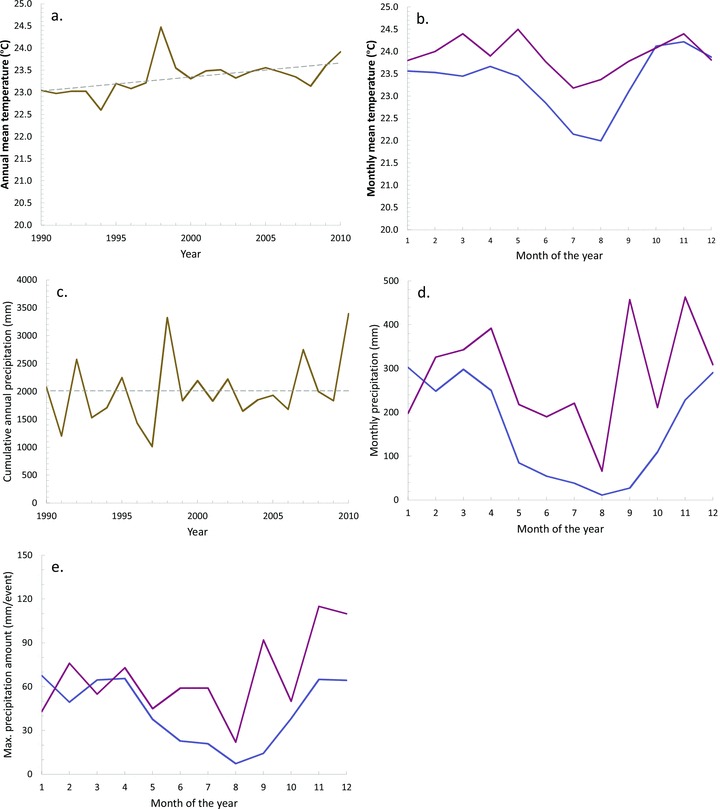
Figure 1.

Trends in climatic conditions in the Malang region, Indonesia. (a) Average annual temperature. (b) Monthly mean temperature. (c) Cumulative annual precipitation. (d) Monthly amount of precipitation. (e) Maximum amount of precipitation in one event per month. Blue lines denote 20 years average (1990–2010), red lines represent the observations for the year of the experiment (2010), results of linear regressions are indicated with dashed lines.
