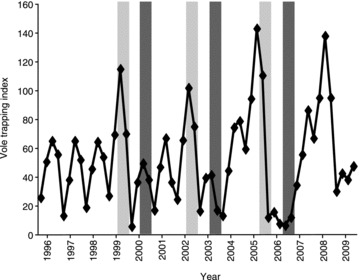
Figure 2.

The trapping index of bank voles during 1996–2009 (trapping index = captured individuals/100 trap nights, monthly data are interpolated from the trappings carried out four times per year; trappings are indicated with diamonds). The six analyzed cycle phases are indicated with light (peak years) and dark (crash years) bars.
