Figure 4.

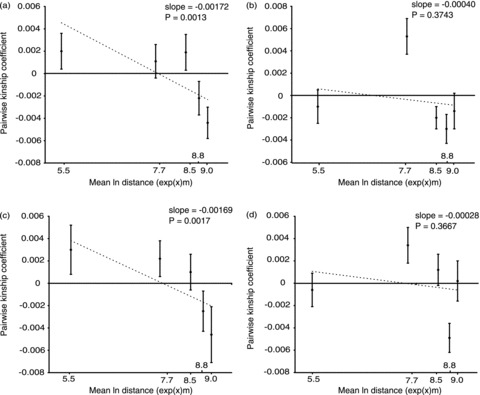
The spatial genetic structure expressed as kinship coefficient (mean ± SE) versus logarithmic distance between the individuals in the cyclic bank vole population. (a) Crash years, (b) peak years, (c) males, and (d) females.

The spatial genetic structure expressed as kinship coefficient (mean ± SE) versus logarithmic distance between the individuals in the cyclic bank vole population. (a) Crash years, (b) peak years, (c) males, and (d) females.