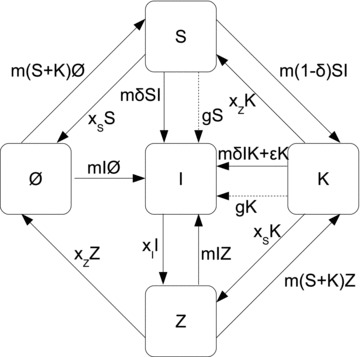
Figure 1.

Flow diagram showing the five metapopulation patch states: empty (ø), occupied with susceptible animals only (S), occupied with infected animals (I), occupied with susceptible animals and free-living pathogen (K), occupied only with free-living pathogen (Z). Also shown with arrows are the transition rules between states along with their transition rates. Parameters are defined in the text.
