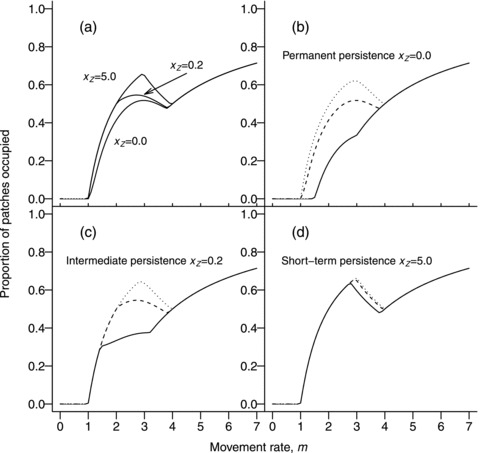
Figure 2.

Proportion of occupied patches in the metapopulation model (1) when the clearance rate of contaminated patches varies between xZ = 0.0 (permanent persistence), xZ = 0.2 (intermediate persistence), xZ = 5.0 (short-term persistence). In plot (a) curves have all remaining parameters in common: extinction rate of susceptible patches (xS = 1.0) and infected patches (xI = 2.0), probability of patch acquiring infection from animal movement (δ = 0.5), and environmental transmission rate ( = 0.2). In plots (b–d) the environmental transmission rate varies between
  = 0.01 (dotted line),
  = 0.2 (dashed line),
  = 0.5 (solid line), respectively.
