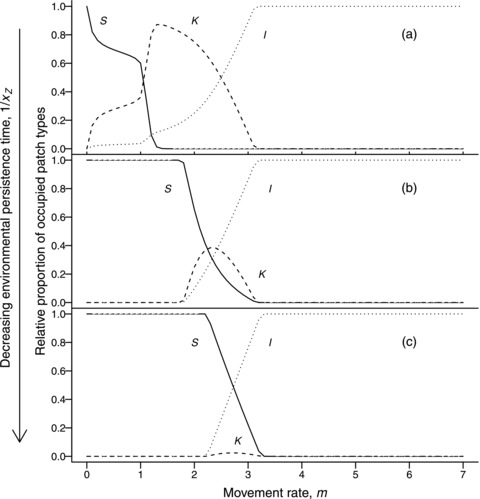
Figure 3.

As in Figure 2a, but showing relative proportion of occupied patches belonging to the three occupied states: S (solid line), K (dashed line), and I (dotted line) for (a)  , (b)
, (b)  , (c)
, (c)  .
.

As in Figure 2a, but showing relative proportion of occupied patches belonging to the three occupied states: S (solid line), K (dashed line), and I (dotted line) for (a)  , (b)
, (b)  , (c)
, (c)  .
.