
Figure 4.
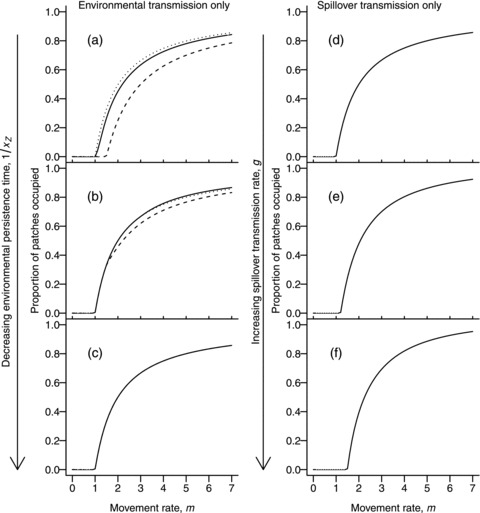
Plots (a–c) show proportion of occupied patches in the metapopulation model (1) with only environmental transmission, showing the effect of the clearance rate of contaminated patches (a) xZ = 0.0 (permanent persistence), (b) xZ = 0.2 (intermediate persistence), (c) xZ = 5.0 (short-term persistence), and the infection rate by free-living pathogen,  = 0.01 (dotted line),
  = 0.2 (dashed line),
  = 0.5 (solid line). Curves have remaining parameters in common (
 ). Plots (d–f) show proportion of occupied patches in the metapopulation model (1) with spillover transmission (dotted arrows in Fig. 1) being the only transmission mechanism (i.e., δ = 0.0,
  = 0.0). Spillover transmission rate is (d) g = 0.0, (e) g = 0.2, (f) g = 0.5. Unless stated otherwise, parameters in plots (d–f) are as in plots (a–c).