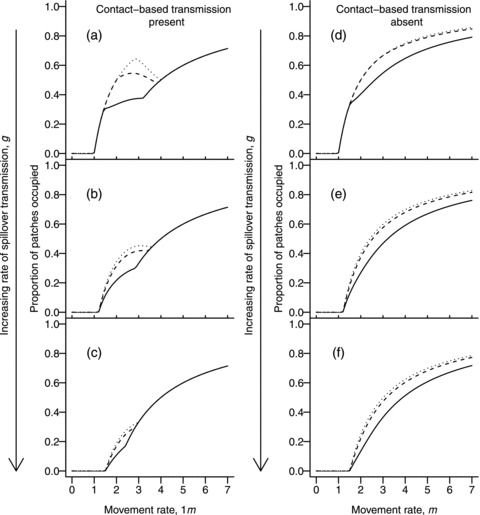
Figure 5.

Proportion of occupied patches in the metapopulation model (1) including spillover transmission. Curves illustrate the joint effects of spillover and environmental transmission in the presence (a–c, δ = 0.5) and absence (d–f, δ = 0.0) of movement-based transmission. The spillover transmission rate is (a and d) g = 0.0, (b and e) g = 0.2, (c and f) g = 0.5; and the environmental transmission rate is: δZ = 0.01 (dotted lines), δZ = 0.2 (dashed lines), δZ = 0.5 (solid lines).
