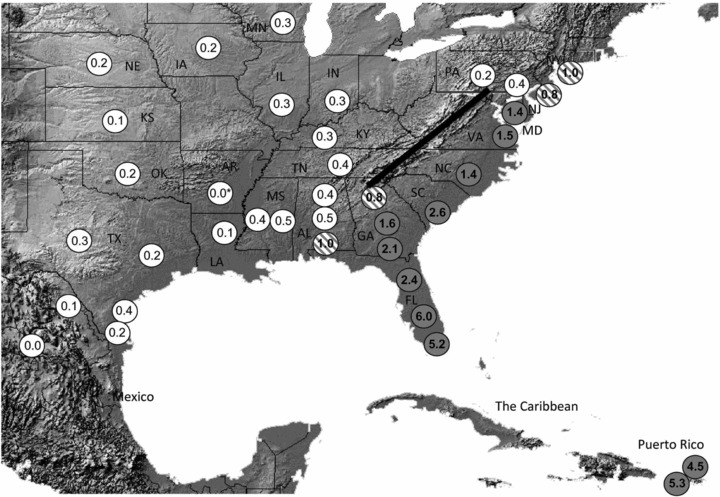
Figure 3.

Map summarizing the geographical distribution of h4/h2 haplotype ratios from collections listed in Table 2. Ratios from central and southern Texas and southern Florida representing multiple years from the same locations were averaged. Shaded circles indicate the FL group with ratios >1.0. Open circles depict the TX group defined by ratios <0.6. Circles with diagonal lines identify collections with intermediate ratios. Haplotype ratios for Puerto Rico are from Nagoshi et al. (2010). The asterisk identifies the ratio obtained from 13 specimens collected at several sites in Arkansas. Because of the small sample size, these data were not included in the analyses in Table 2 or 3, but is presented here to show consistency with neighboring areas. Diagonal line follows the major elevations of the Appalachian Mountain range. Map courtesy of the United States Geological Survey.
