Figure 1.

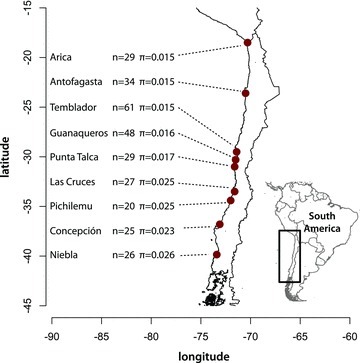
Sample locations are indicated along the coast of Chile, with mitochondrial haplotype sample size and overall nucleotide diversity (π) indicated.

Sample locations are indicated along the coast of Chile, with mitochondrial haplotype sample size and overall nucleotide diversity (π) indicated.