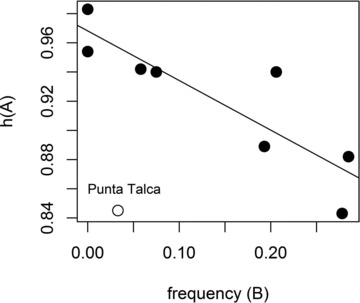
Figure 3.

Linear regression of haplotype diversity in the A lineages at each sampled location against the 2010–2011 frequency of the B haplo-group at that location. The data for Punta Talca from 2010–2011 are shown in white and are statistically identified as an outlier (note the observed frequency for Punta Talca in 2004–2006 was 0.33); exclusion of this data point generates a significant relationship in which the frequency of B has a higher Akaike weight (0.70) than latitude in explaining h(A), though the frequency of B and latitude are also correlated.
