
Figure 1.
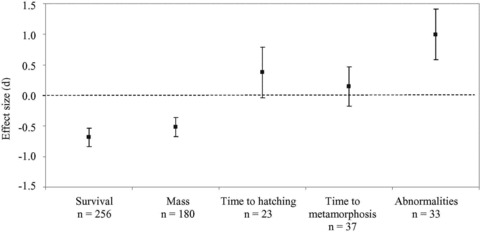
Effect size (mean and 95% confidence interval) for full models for the effect of pollutants on amphibian survival, mass, time to hatching, time to metamorphosis, and abnormality frequency. The number of point samples used to calculate each mean is shown. Means with confidence intervals that overlap the line at zero are not significantly different from zero.