
Figure 2.
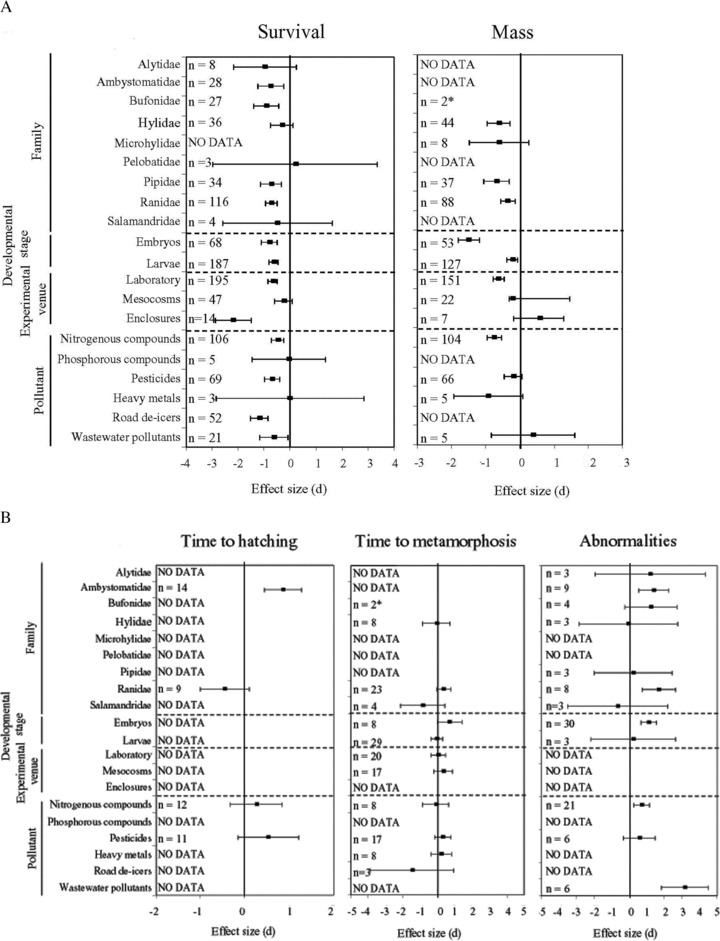
Effect (mean and 95% confidence interval) of pollutants on survival, mass, time to hatching, time to metamorphosis, and abnormality frequency for the categories considered for the a priori defined groups. The number of point samples used to calculate each mean is shown for each analysis. The expression “no data” denotes both those classes for which actually no data were available and those for which fewer than two valid studies (see Material and Methods for more detail). Effect sizes were considered significant if 95% confidence intervals did not overlap with zero. Effect sizes within analyses were considered different from one another if their 95% confidence intervals did not overlap. Notice the different scales for each variable shown. *For clarity, statistics corresponding to categories showing small sampling size (n≤ 2) are not shown in the graphic.