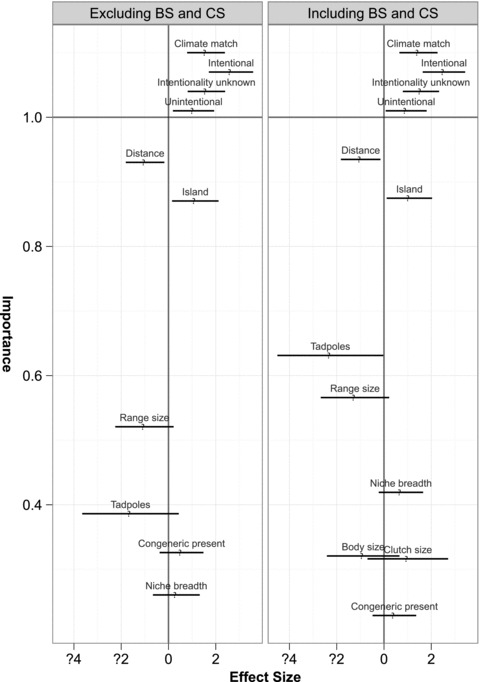
Figure 1.

Average effect sizes (represented by dots) with 95% confidence intervals (represented by bars). Results from the analysis of the dataset including body size and clutch size are shown in the right panel. Results from the dataset excluding body size and clutch size are shown in the left panel. All factors are ordered vertically according to their relative importance. Factors included in all top models (intentionality and climate match) with a maximum importance of 1 are included at the top. Levels of categorical variables have been adjusted not to overlap.
