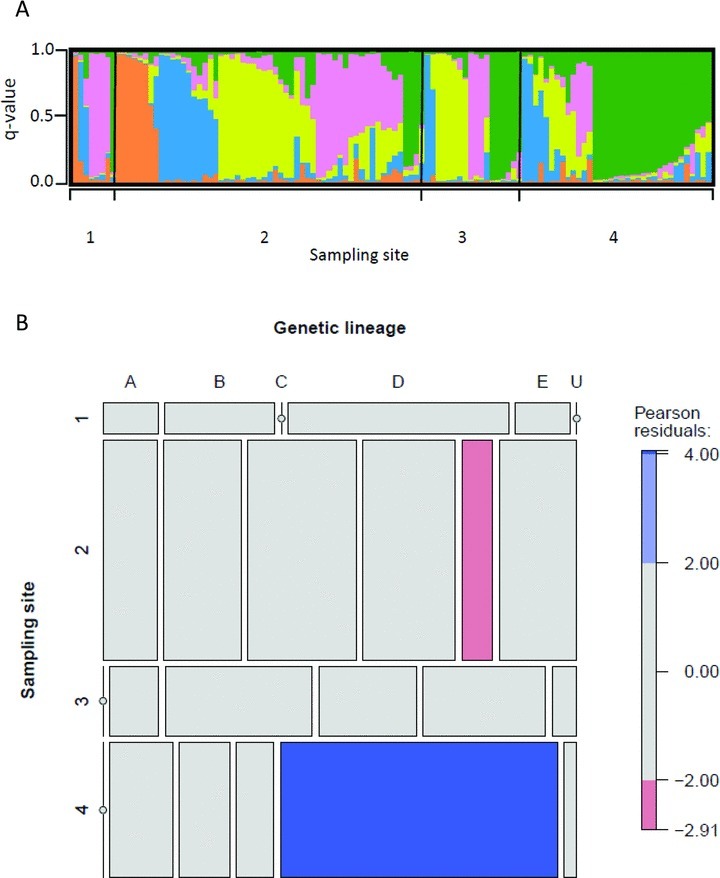
Figure 4.

(A) Assignment of sampled Kryptolebias marmoratus to five self-fertilizing lines (clusters, A–E) using the Bayesian clustering algorithm INSTRUCT. Each individual is represented by a single bar and colors represent the individual's proportionate genetic membership (q) in a given cluster. (B) Mosaic plot representing significant excess (blue) or deficit (pink) of genetic line (A–E, U, unclassified) by sampling sites (1–4), based on standardized residuals. Size of rectangles is proportional to sample size.
