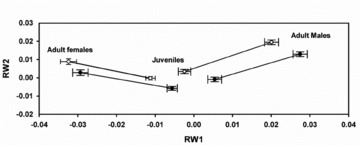
Figure 4.

Relative warp plot of least squares means (±1 SE) for juvenile and adult male and female Brachyrhaphis rhabdophora from predator (filled symbols) and nonpredator (open symbols) environments. The first two relative warps account for 34.5% and 17% of the variation, respectively.
