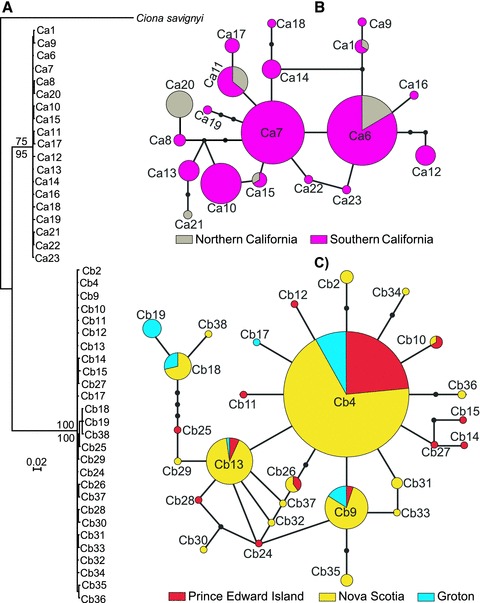
Figure 3.

Bayesian inference (BI) tree (A) based on mitochondrial cytochrome c oxidase subunit 3–NADH dehydrogenase subunit 1 (COX3-ND1) haplotypes, and haplotype networks generated with TCS for Ciona intestinalis spA (B) on the west coast and C. intestinalis spB (C) on the east coast of North America. Haplotype and population names as per Table 1. For the BI tree, posterior probabilities for Bayesian inferences (in percentage, above branch) and bootstrap values (below branch) for neighbor-joining reconstruction are shown at major nodes. For the TCS network, sampled haplotypes are indicated by circles and missing or unsampled haplotypes are indicated by solid black dots. Haplotypes are color coded according to different geographical regions.
