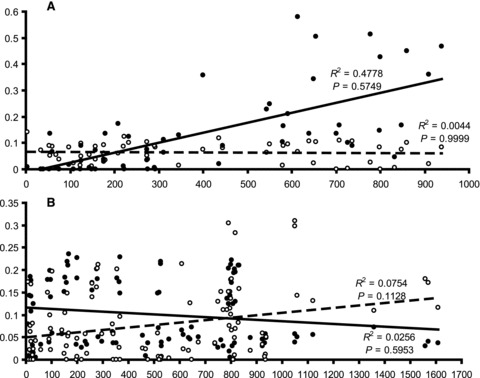
Figure 4.

Correlation between geographical distance in kilometers (x-axis) and genetic distance given as FST/(1 –FST) for microsatellite data and ΦST/(1 –ΦST) for mitochondrial data (y-axis) in Ciona intestinalis spA on the west coast (A) and spB on the east coast (B) of North America. Open and solid cycles represent data derived from mitochondrial and microsatellite markers, respectively.
