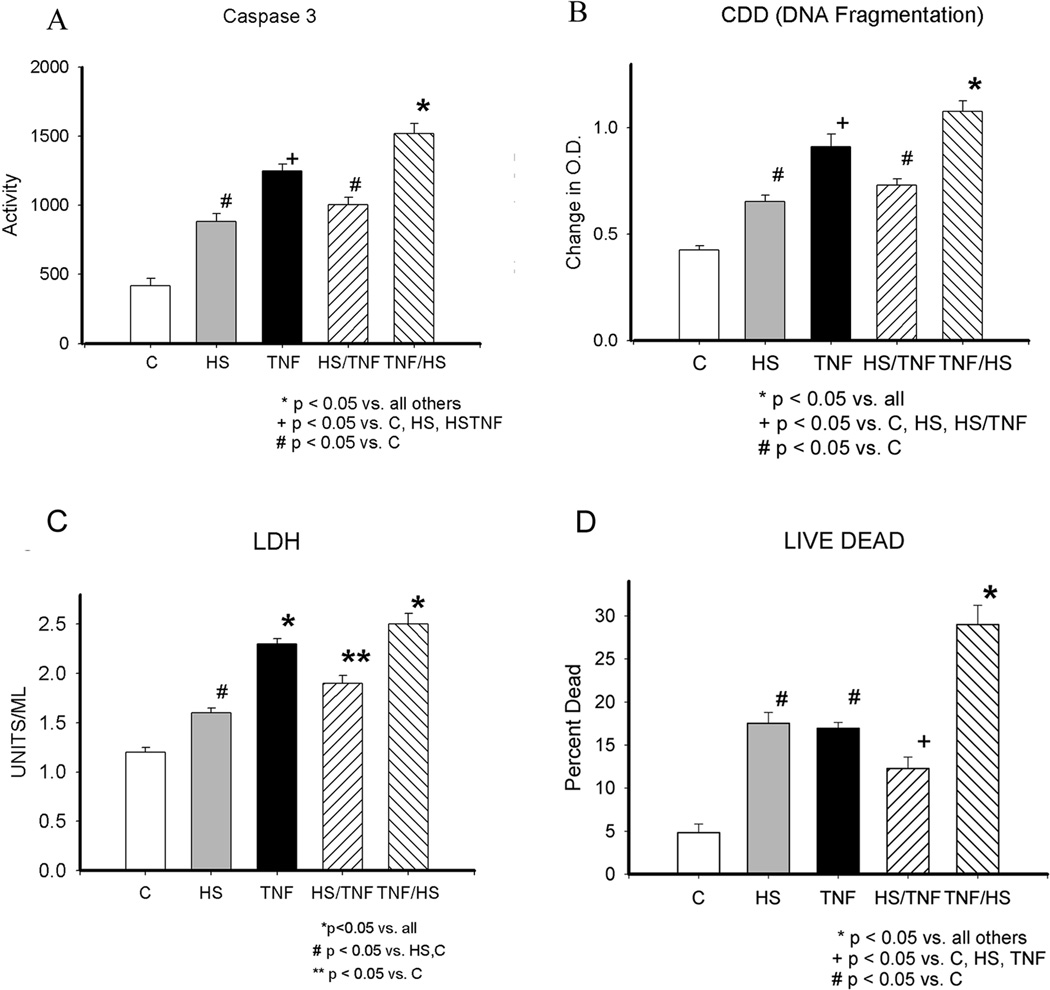
Figure 2.
A) Caspase 3 activity at 16h. B) DNA fragmentation by CDD or cell death assay (Roche) at 19h. C) LDH release at 19 h. D) Live Dead Assay. Percent of cells dead based on ethidium bromide uptake vs. metabolism of calcein in live cells at 19 h. C - control; HS - heat shock; HSTNF - 1 h hs followed by TNF treatment; TNFHS - 6 h TNF followed by 1 h hs. * p < 0.05 vs. all others, + p < 0.05 vs. C, HS, HSTNF, # p < 0.05 vs. C. Graphs summarize 3–6 experiments with 9–18/group.

