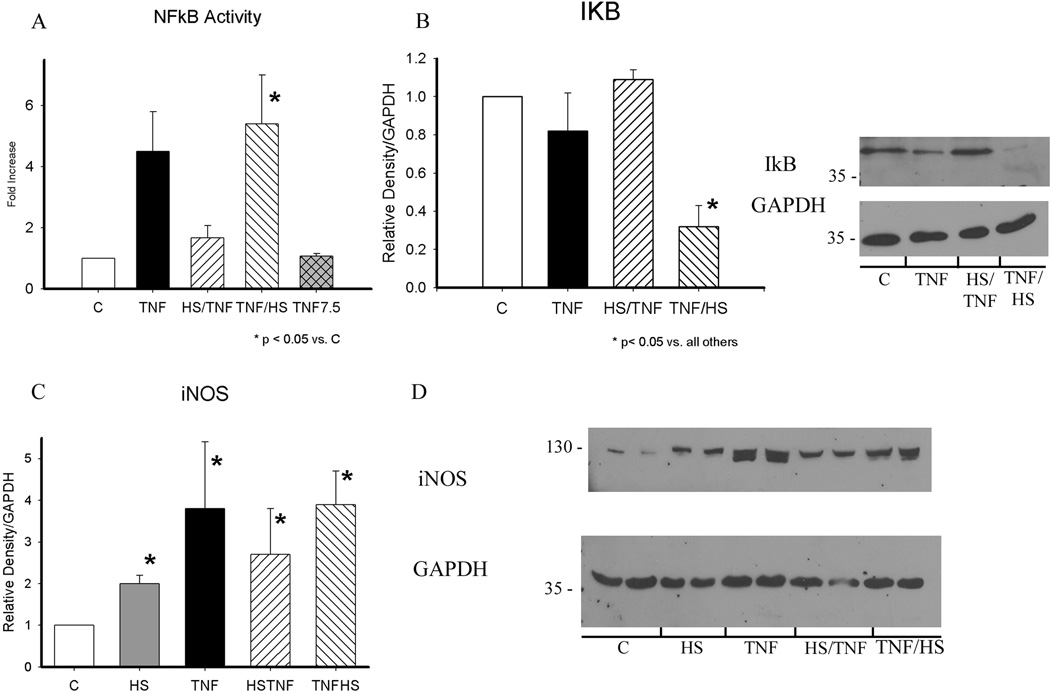
Figure 4.
A) NFκB activation was measured by assay 30 min. after completion of all treatments. TNF at 30 min. (black bar) and at 7.5 h (cross-hatched bar) are shown for comparison. * p < 0.05 vs. C (control). B) I6Bα expression was examined at 19h. Levels were decreased in TNF/HS group only. Graph summarizes results. Representative western with GAPDH on the same blot shown on right. * p <0.05 vs. all. C) iNOS levels were increased in all groups. * p < 0.05 vs. C. D) Representative western for iNOS. GAPDH for same blot shown below. All protein samples collected at 19 h. Graphs summarize results of 3–5 separate experiments. C - control; HS - heat shock; HS/TNF - 1 h hs followed by TNF treatment; TNF/HS - 6 h TNF followed by 1 h hs.

