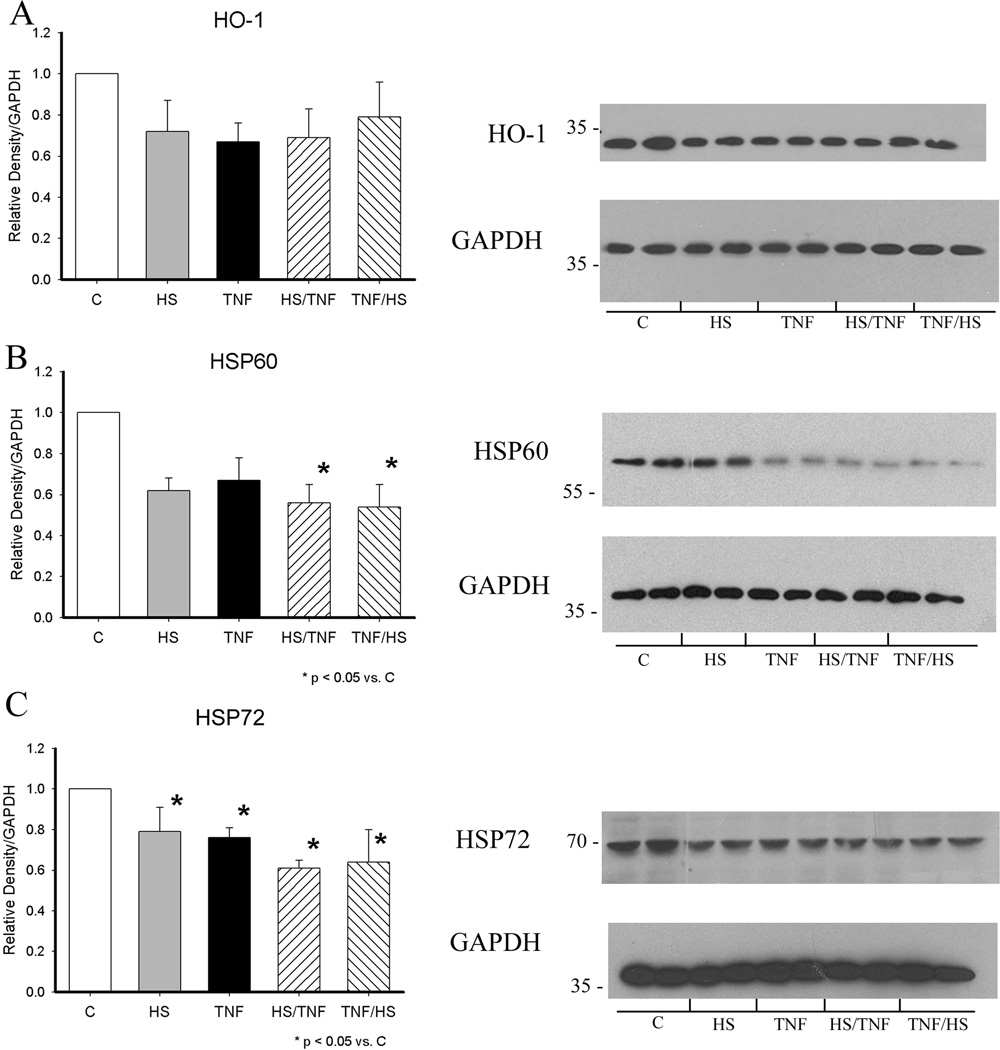
Figure 6.
HSF DNA binding decoy and HSP expression at 19 h. A) HO-1 protein levels were unchanged. B) HSP60 protein expression was decreased in all groups compared to control. C) HSP72 expression was decreased in all groups compared to control. Graphs summarize results of multiple westerns. Data normalized to control group. Representative western for each protein and GAPDH on same blot shown. N = 3–4/group. * p < 0.05 vs. C.

