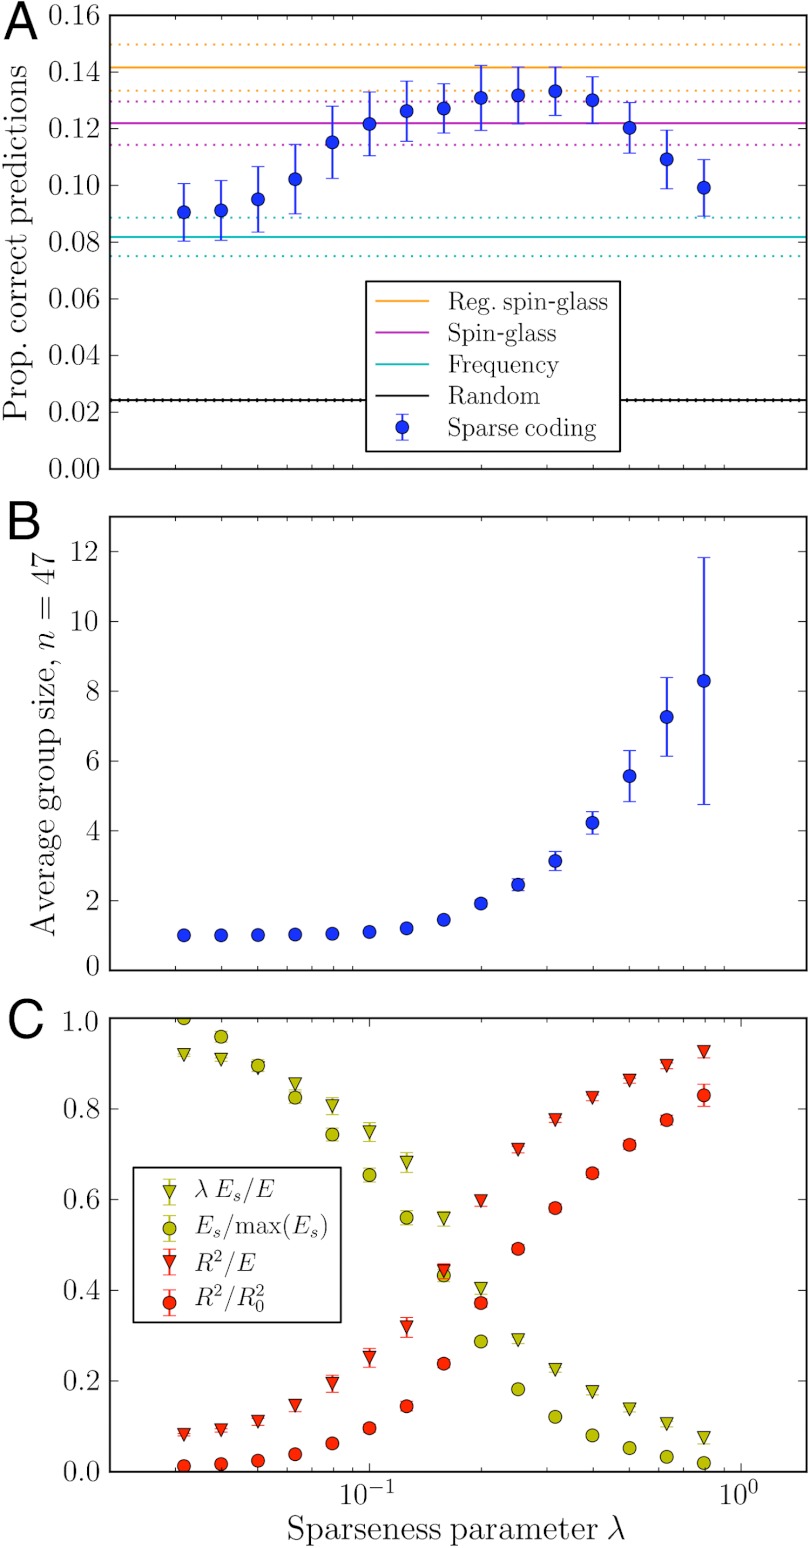
Fig. 2.
(A) Predictive power versus sparseness. The best predictions of out-of-sample participant identities happens at an intermediate value of λ. Sparse coding performs significantly better than the frequency model and as well as pair-wise methods. The regularized spin-glass model is limited to include only 26 individuals (SI Text). (B) Average group size (the average number of large elements in each basis vector containing at least one large element, considering the n = 47 largest elements) versus sparseness. For increasing sparseness, individuals are collected into fewer groups with larger group size. (C) The two terms in E as a function of λ. As λ increases, we first have overfit representations (small R2) that are not sparse (large Es), and then vice versa. Over the range of λ that resolves the peak in predictive power, the sizes of R2 and Es relative to their sum (triangles) and to their maximum values (circles) vary appreciably. Error bars and dotted lines indicate +/- one standard deviation over 100 instances: 10 random selections of in-sample/out-of-sample data times 10 random initial conditions for sparse minimization.

